QorusDocs acquires Shark Finesse
Learn moreBook your demo
Please complete the form below and we will contact you to arrange a convenient time to show you how our software can help you.

Oops! Something went wrong while submitting the form.
Please complete the form below and we will contact you to arrange a convenient time to show you how our software can help you.
When you enter customer data into the benefit calculator a small graph will appear at the bottom of the calculator showing the cash profile of that benefit:

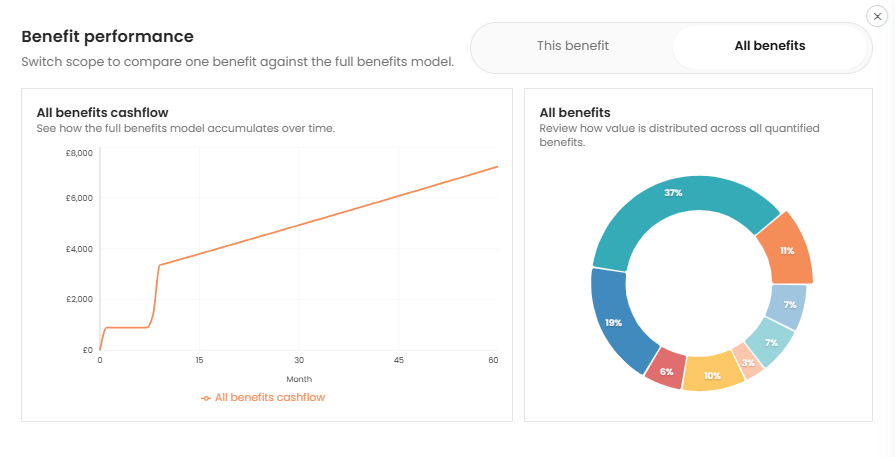
To see more detail, select the arrow to the left side of benefit to open the drawer. The first screen shows benefit performance of that individual benefit - the benefit cash profile graph as well as a graph demonstrating the proportion of that individual benefit against the total benefits:

You can then select All Benefits to see the performance of the benefits in total:


We need to confirm your email address.
To complete the subscription process, please click the link in the email we just sent you.


